Bring Your Business Data to Life

Bring Your Business Data to Life with DecodeData’s Power BI Experts

Book Free Consultation
Data management process

Why Data Visualisation Matters?

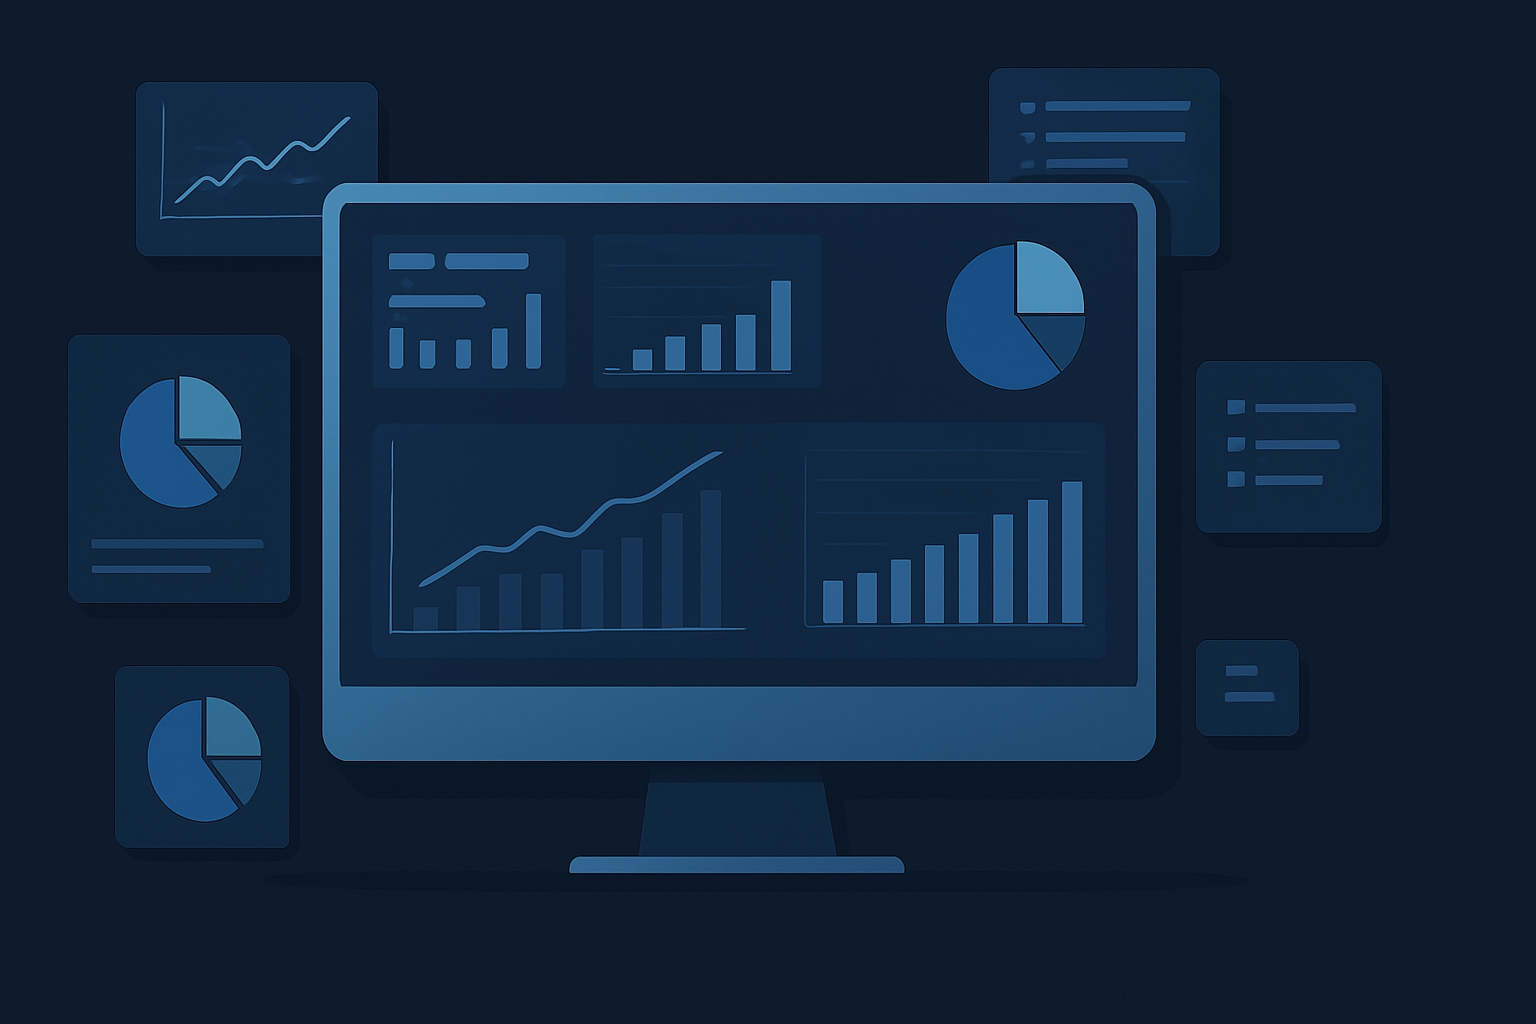
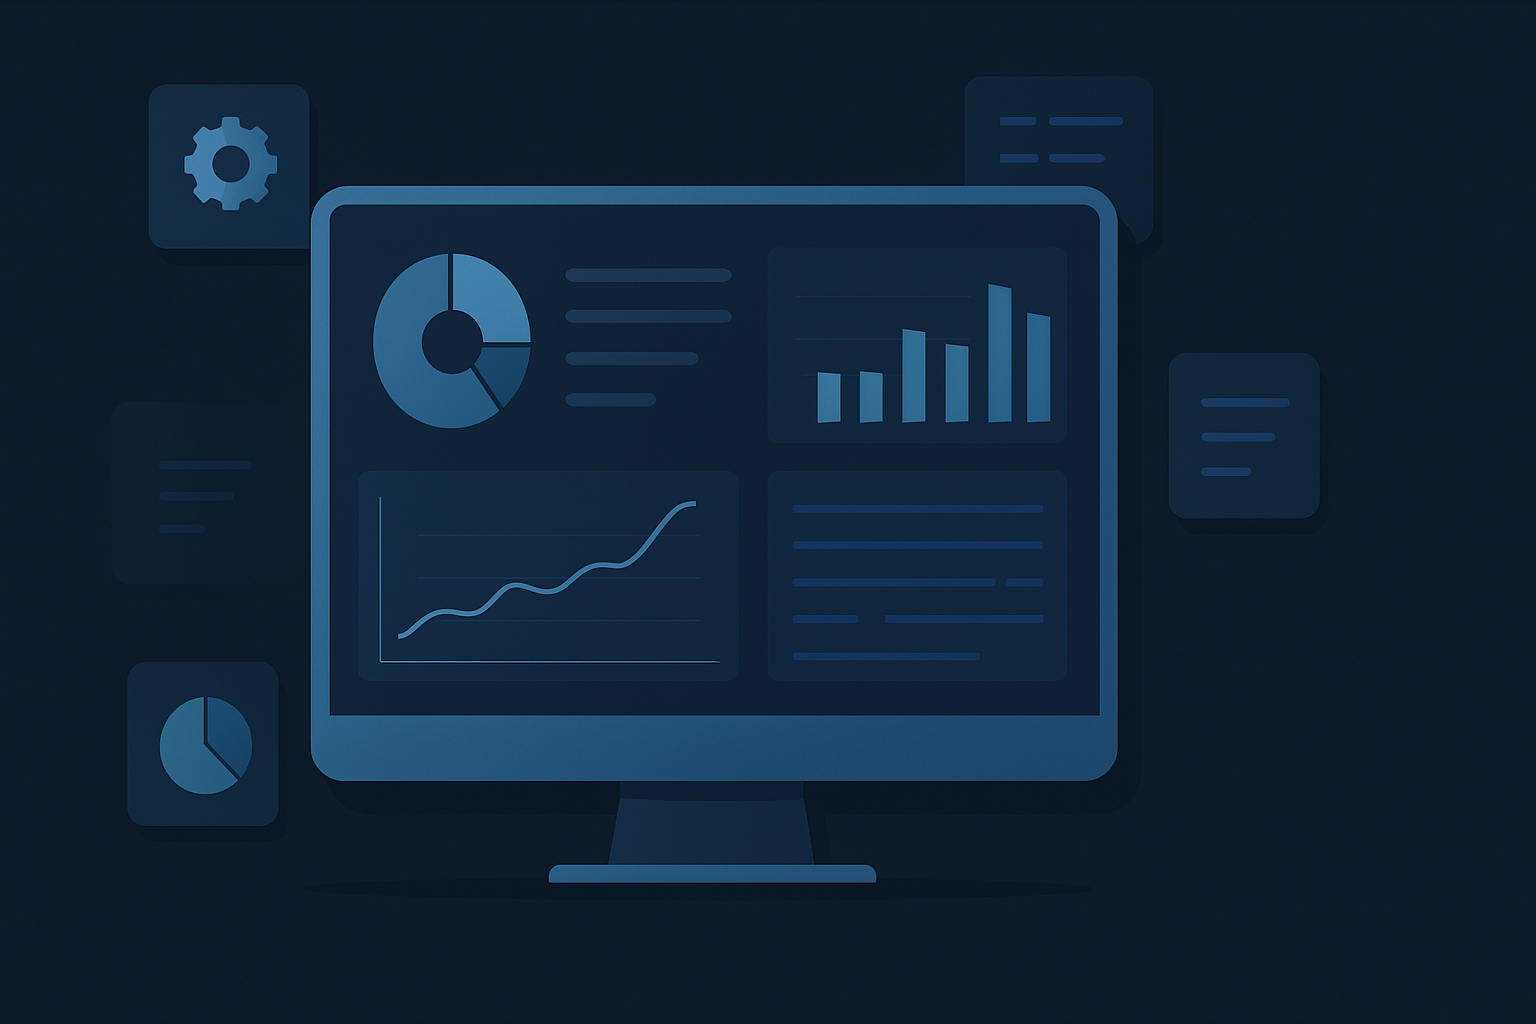
In today’s data-rich world, spreadsheets and static reports just don’t cut it. Data visualisation bridges the gap between raw numbers and business insight—helping teams move from confusion to clarity. Well-designed dashboards are more than just charts—they tell a story. Whether it's identifying bottlenecks in operations, tracking KPIs in real time, or presenting high-level summaries to the board, visualisation makes data accessible, actionable, and meaningful.
Benefits of Powerful Visualization

Faster Decisions

Spot trends and patterns instantly

Better Collaboration

Share insights across teams easily

Improved Performance

Monitor key metrics in real-time

Time Saving

Eliminate manual reporting

Executive-Ready

Impress stakeholders with professional reports

Our Power BI Solutions

Tailored dashboards for every business function

Executive dashboard
C-Level Dashboards
  • High-level strategic insights
  • Drill-down capabilities
  • Real-time KPI tracking
Operations dashboard
Operational Dashboards
  • Real-time process monitoring
  • Performance analytics
  • Team-specific views
Self-service analytics
Self-Service Analytics
  • User-friendly exploration
  • Pre-built data models
  • Governed data access
Data storytelling
Data Storytelling
  • Narrative-driven insights
  • Audience-specific journeys
  • Interactive presentations

Our 6-Step Approach

1. Discovery & Planning

Understand your business needs and decision-making processes

2. Data Assessment

Evaluate data sources, quality, and integration points

3. Dashboard Design

Co-create visual designs and KPI maps with stakeholders

4. Build & Validate

Develop using Power BI best practices with iterative feedback

5. Rollout & Training

User adoption programs and self-service enablement

6. Continuous Improvement

Ongoing optimization and evolutionary updates

Demo Dashboards

* Interact with Live Dashboards

Success Stories

Frequently Asked Questions

Absolutely. Every solution is custom-built to match your processes, KPIs, and user roles.

Yes! We design dashboards for all functions—ensuring each team gets the right data in the right format.

Our pricing depends on the complexity and scope. We offer flexible engagement models—from fixed-cost projects to monthly managed services.

Typically, a dashboard MVP (Minimum Viable Product) can be delivered within 2–4 weeks. Timelines vary based on data availability and business needs.

Yes. Our team includes Microsoft Certified Power BI Professionals with 15+ years of experience in data and business processes.

Definitely. All dashboards are optimised for access across devices—desktop, mobile, and tablet.

Contact Us

Contact Information

info@decodedata.com.au
(02) 4072 5755
Level 1, 60 Martin Place
Sydney NSW 2000

Start a Conversation